In the previous post about the ESXi network IOchain we explored the various constructs that belong to the network path. This blog post builds on top of that and focuses on the tools for advanced network troubleshooting and verification. Today, vSphere ESXi is packaged with an extensive toolset that helps you check connectivity or verify bandwidth availability. Some tools are not only applicable for inside your ESXi box but also very useful for the physical network components involved in the network paths.
Access to the ESXi shell is a necessity as the commands are executed here. A good starting point for connectivity troubleshooting is the esxtop network view. Also, the esxcli network commandlet provides a lot of information. We also have (vmk)ping, and traceroute at our disposal. However, if you are required to dig deeper into a network issue, the following list of tools might help you out:
- net-stats
- pktcap-uw
- nc
- iperf
Net-stats
We’ll start of with one of my favorites; net-stats. This command can get you a lot of deep dive insights on what is happening under the covers of networking on a ESXi host as it can collect port stats and . The command is quite extensive as it allows for a lot of options. The net-stats -h command displays all flags. The most common one being the list option. Use net-stats -l to determine the switchport numbers and MAC addresses for all VMkernel interfaces, vmnic uplinks and vNIC ports. This information is also used for input for other tools described in the blog post.
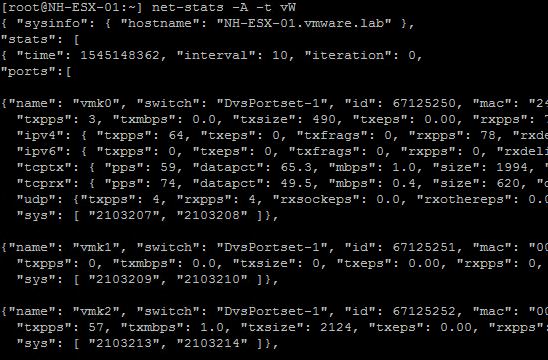
To give some more examples, net-stats can also provide in-depth details on what worldlets (or CPU threads, listed as “sys”) are spun up for handling network IO by issuing net-stats with the following flags: net-stats -A -t vW. Output provided by these options help in verifying if NetQueue or Receive Side Scaling (RSS) is active for vmnic’s by mapping the “sys” output to the worldlet name using i.e. the vsi shell (vsish -e cat /world/<world id>/name).
Using different options, net-stats provides great insights on network behaviour.
Pktcap-uw
vSphere ESXi 5.5 and later is shipped with pktcap-uw next to the tcpdump-uw tool. The latter was already shipped with ESX(i) since the early versions. Both tools compliment each other and can be used together or separately. The tcpdump-uw tool is only able to capture packets at the VMkernel interface level. The pktcap-uw tool allows you to also capture frames at the uplink, vSwith or, virtual port levels. Therefor, is provides for a lot more flexibility and improved troubleshooting. We have a KB article that provides detailed information about different options using pktcap-uw.
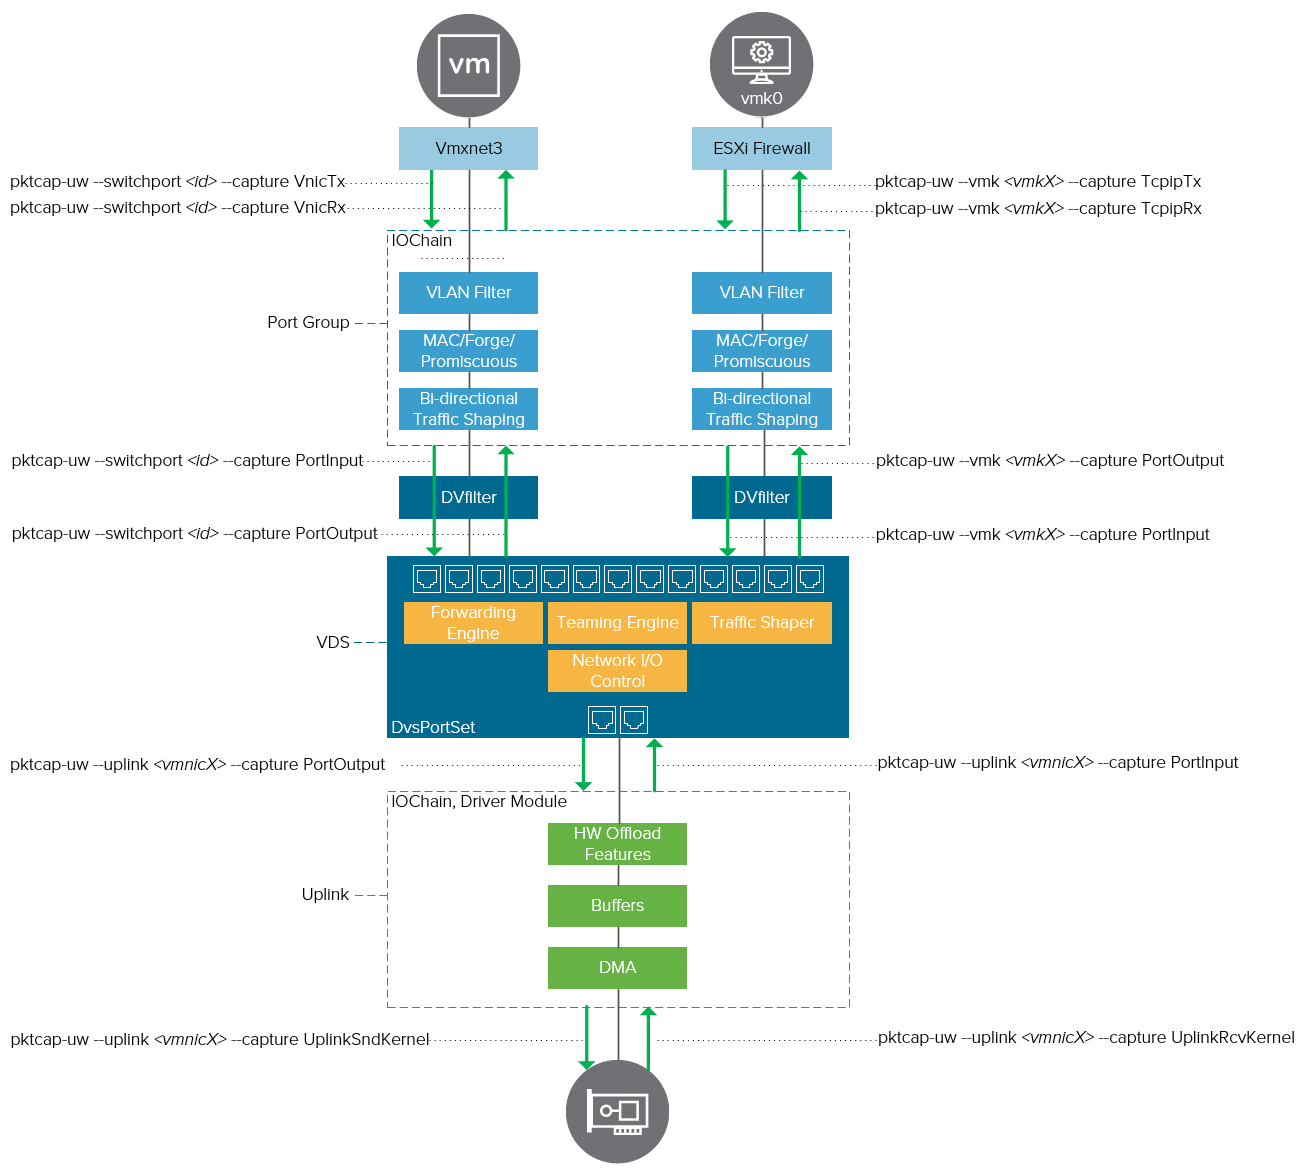
I would like to highlight some of the options with regards to the diagram we know from the previous blog post. It details on what syntax to use to get the correct data of the network path level of choice.
Besides capturing packets on a specific point along the path, we do have more general options and tips & tricks. For example:
- Filter all frames for a specific MAC address:
pktcap-uw --mac xx:xx:xx:xx:xx:xx
- Filter explicitly for a IP:
pktcap-uw --ip x.x.x.x
- Automatically run pktcap-uw by using sleep:
pktcap-uw $sleep 120; pkill pktcap-uw
- Limit your capture by packet count:
pktcap-uw -c 100
- Output your capture to review offline:
pktcap-uw -P -o /tmp/example.pcap
NC
Next up is perhaps a less known command. NC stands for NetCat and is a oldschool linux command. It is the perfect tool for verifying connectivity on a specific port since telnet is not available in ESXi. For example, to verify if the iSCSI port on a storage array is reachable.
nc -z <destination IP> 3260
Please review this KB article for more information!
Iperf
Iperf is a bandwidth tool. It tests the maximum bandwidth between a source and destination. Typically used from within a VM but in this case the source and destination being the ESXi host itself. It is baked into ESXi because of the VMware vSAN proactive network performance test that is accessible in the UI. We can ‘mis-use’ iperf for other purposes as well. We can use any VMkernel interface in a ESXi host.
By default, ESXi will not let you run iperf3 in server mode from the shell. It raises an “Operation not permitted” error. The trick is to create a copy of iperf using the following syntax:
cp /usr/lib/vmware/vsan/bin/iperf3 /usr/lib/vmware/vsan/bin/iperf3.copy
Because by default iperf3 runs on ports that are not permitted in the ESXi firewall. One option is to temporarily disable the firewall. Another option is to create additional ESXi firewall entries. Just be sure to enable the ESXi firewall afterwards!
esxcli network firewall set --enabled <false / true>
Now issue iperf3.copy with the -s tag on the destination ESXi host. The beauty of this, is that all VMkernel IP’s can be used. So if you want to test the management network, bind iperf3 with the management IP. The same goes for the vMotion network or any other VMkernel interface!
Server (ESXi host 1):
/usr/lib/vmware/vsan/bin/iperf3.copy -s -B 192.168.200.91
Client (ESXi host 2):
/usr/lib/vmware/vsan/bin/iperf3.copy -c 192.168.200.91
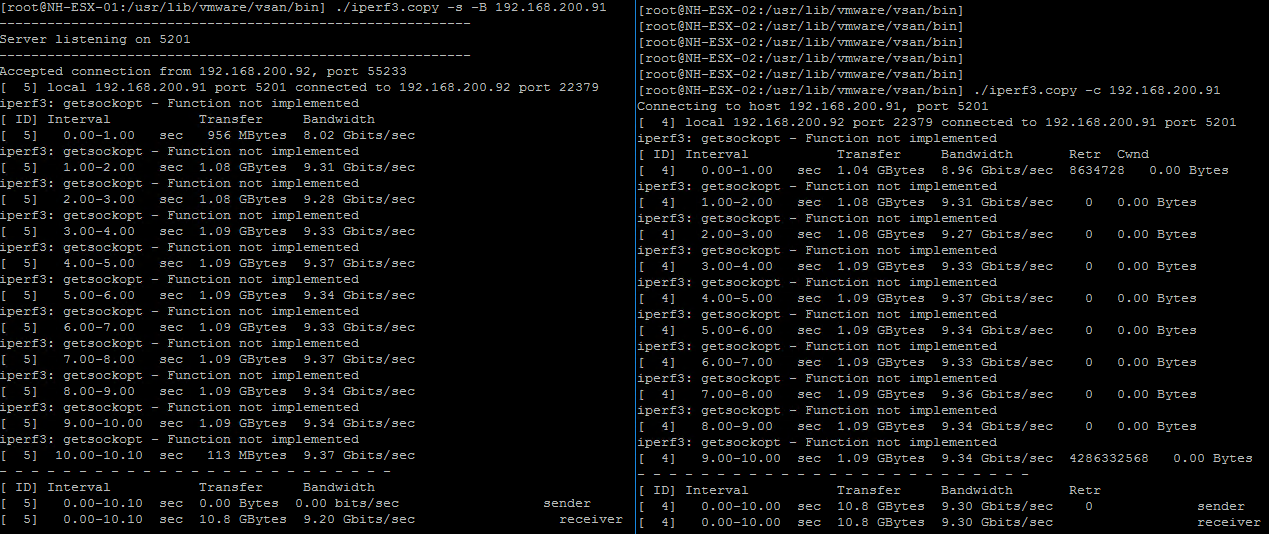
Output will look similar to the following screenshot:
All other iperf3 options are supported, like parallelism, format or the maximum segment size.
To Conclude…
This concludes the write-up on ESXi network troubleshooting. The tools discussed are really extensive in number of options and settings, we only scratched the surface here. I encourage you to get familiar with all tools available. Explore and test them to get better understanding on virtual network characteristics in your VMware environment.


